
Entdecken Sie die Zukunft mit ELWASIVE
Wir bei ELWASIVE bieten innovative Lösungen, die Ihr Unternehmen auf die nächste Stufe heben.
How to Create a Professional Wind Potential Map Using Surfer Software
Learn how to use Surfer Software to create a wind potential map for a specific district. In this step-by-step tutorial, I'll show you how to import wind data, generate wind potential maps, and analyze the results for wind energy assessment. Whether you're in renewable energy, GIS, or environmental research, this guide will help you visualize and evaluate wind resources effectively. 🔹 Topics Covered: ✅ Importing wind data into Surfer ✅ Creating a wind potential map ✅ Customizing map visualizations ✅ Interpreting wind potential for site selection
Wind Turbine Annual Energy Production (AEP) Calculator in Excel
In this video, I explain how to calculate the Annual Energy Production (AEP) of a wind turbine using Excel. The tutorial covers the theoretical background, wind speed probability distribution, power curve analysis, and step-by-step implementation of the AEP calculation. Topics Covered ✅ Wind speed probability distribution (Weibull distribution) ✅ Cumulative distribution function (CDF) ✅ Wind turbine power curve ✅ Annual Energy Production (AEP) calculation ✅ Excel implementation and automation ✅ Practical examples and engineering applications
Wind Data Analysis in Excel with VBA | Dashboard, 12 Sectors and WAsP Weibull Fit
Learn how to build and use an automated wind data analysis dashboard in Microsoft Excel with VBA. In this tutorial, I demonstrate a complete workflow for processing hourly wind measurements, creating directional frequency distributions, analyzing monthly and diurnal wind patterns, and calculating directional Weibull parameters using a WAsP-style histogram fitting method. The links for the required files mentioned in the first comment, so you can download all of them and use them for generating your dashborad.
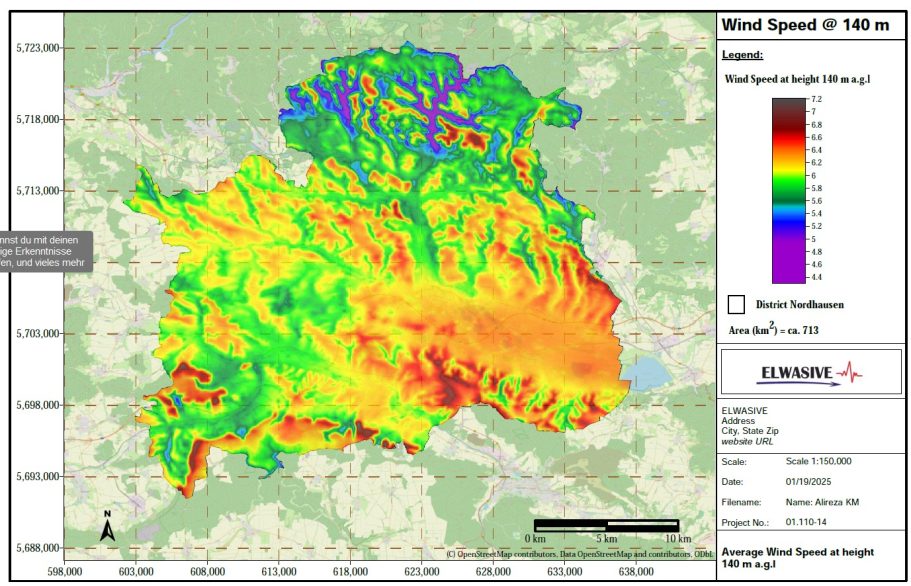
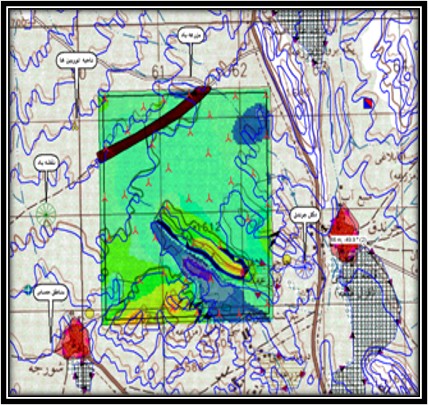
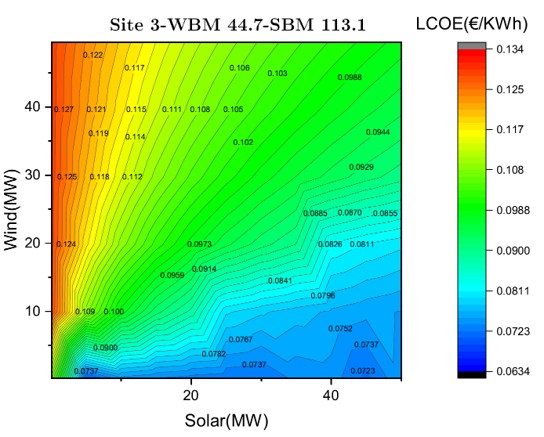
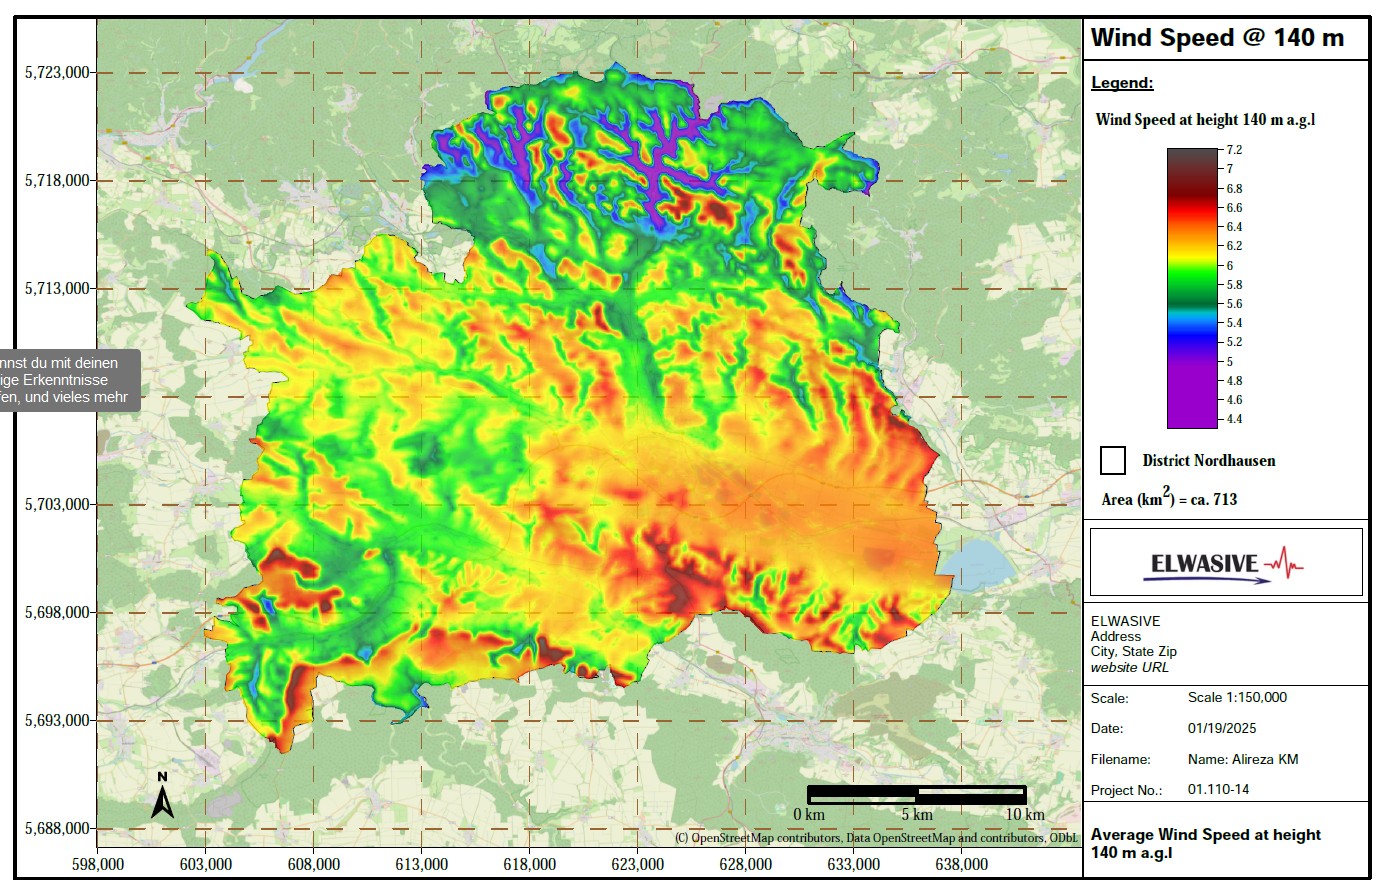
vorherige Simulationen
Die technische Windressourcenerfassung ist ein entscheidender Schritt bei der Planung von Windkraftanlagen. Sie umfasst die Analyse von Winddaten, die durch Messstationen oder Wettermodelle gewonnen werden, um die potenzielle Energieerzeugung an einem Standort zu bewerten. Zu den wichtigen Aspekten gehören die Erfassung von Windgeschwindigkeiten, -richtungen und -häufigkeiten über einen bestimmten Zeitraum. Diese Daten helfen dabei, die optimalen Standorte für Windturbinen zu bestimmen und die wirtschaftliche Rentabilität von Windprojekten einzuschätzen. Durch moderne Technologien wie Lidar und SODAR wird die Genauigkeit der Windmessungen weiter verbessert, was zu einer effektiveren Nutzung der Windressourcen führt.